


The SensDesk Technology is a portal solution from the HW group to manage remote sensors and devices (only for HW group products).
- The portal can run online as saas service or off-line in a closed system, check the SensDesk licenses.
- SensDesk Technology based portals offer a central overview of all the values, provides sending the alarms, reporting, outputs into the Open API, etc.
- HWg-cloud.com is a free service-oriented portal with limitted functions. Check details here.
- SensDesk.com is an online paid service provided by HW group company. Services are there available based on selected paid subscription plan.
- The Portal Providers are 3rd party companies running their own installations of SensDesk Technology based portals (using various commercial names).
Below you will find an overview of all the topics covered in this article:
Basic properties
-
More than 30 different monitoring devices can be connected to the SensDesk technology based portal.
-
Product families: Poseidon2, Damocles2, Ares
-
STE2, STE, WLD2
-
IP WatchDog, HWg-PWR
-
IoT Monitoring: SD-xx, NB-xx
-
-
The service supports more than 50 different Sensors and Detectors
-
Measuring the temperature, humidity, voltage, CO2, VoC, lighting
-
Detecting the smoke, open doors, Power supply presence (DI inputs)
-
Inputs for industrial sensors 4-20 mA
-
M-Bus meters for the consumption of heat, gas, water, electricity
-
Pulse counters (S0) for measuring the water consumption
-
-
The number of Sensors, DI and DO is limited by the capacity of the connected devices only.
-
The portal displays graphs of sensors’ values.
-
MultiGraphs can combine different quantities (from different devices) in a single graph.
-
The portal displays a graph of the status of DI (Digital Inputs) over time.
-
From the portal web, the DO (Digital Outputs, e.g. relays) of any connected device can be controlled.
-
DO outputs can be automatically controlled by defined Actions (e.g., closing the relay when the temperature of at least two sensors exceeds 25°C).
-
-
Portals can
-
Call (Voice Call) and send an SMS when an alarm occurs.
-
Based on current Sensor (DI) values, the relay outputs can be switched by the Actions in SensDesk Technology based portal.
-
Send CSV or PDF reports (graph + record of alarms).
-
The system supports several users to operate a single Team (company).
-
-
Open API

-
XML: A list of all the sensors / current values can be downloaded in XML format (http get).
-
SNMP: All the values can be read via SNMP v1 / v3 protocol
-

-
Remote Device management
-
Remote FW upgrade for some products
-
SD SafeRange settings for each sensor
-
Central management of email alerts from DI and Sensors
-


-
Limitations of the portal (SensDesk.com in this case)
-
The service can be subscribed for a year in several user’s plans (versions)
-
The history of measured data according to user’s plan is from 30 to 730 days.
-
The Device limit of the account depends on user’s plan.
-
The monthly limit of sent SMS and alarm Voice calls depends on user’s plan.
-
An individual user’s plan (Custom Plan) is available.
-
9 reasons for paying the portal
-
All the Sensors, DI and DO of the company (Team) are displayed on a single screen. Even the sensors connected via GSM or LTE are included.
-
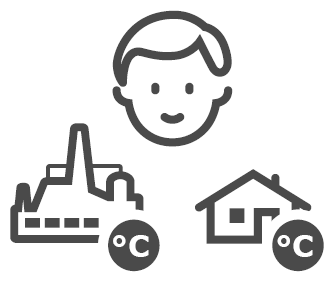
An email about a power or air conditioning failure (temperature problems) at a remote branch is delivered to the service department in time. If an email is not sufficient, a person currently in service is called and an SMS is delivered to the responsible.
-
A PDF report with an overview of delivered services is added to the monthly invoice issued by the IT company to verify that the services were provided properly.
-
A drug-store in a hospital monitors the storage of medicines and archives the Gamp5 report for supervisory authorities.
-
Within few minutes, the owner of the company is informed by an SMS and a Voice call that there is probably a water accident in the building and first drops of water appeared on a detection cable.
-
Thanks to multi-graphs, multiple values in a single graph can be monitored and can help to reveal relationships among individual events (e.g., a higher temperature in a server room + an open door / or a higher temperature in a server room + a higher temperature in the entire building -> possible failure of the central air conditioning unit ...)
-
Thanks to an open API (SNMP + XML), the portal can be integrated into third-party (corporate) systems and can thus increase the efficiency.
-
You can have 2 years of data history, compare historical data easily.
-
Our support covers both hardware and software (service) together.
Advantages of the portal over "standalone" solutions
The HW group delivers two groups of monitoring products:
-
Standalone Monitoring products
Devices can work independently, and a portal is not mandatory.
Standalone products send emails, and can be connected via SNMP to NMS (Network Monitoring System). The products are of a multi-purpose nature. Connecting device to the Portal does not limit alarms being sent from the devices directly.
Configuration of products is more complex, and a connection to the portal is just one of the usage.
In the default device configuration there is no Portal preconfigured -
IoT Monitoring products
Devices are generally more simple (single-purpose) ones. Installation is extremely easy.
Installation consists of connecting the device to the power supply and gluing it to the wall. Usage of any SensDesk Technology based portal is mandatory.
The HWg-cloud.com portal is preconfigured in default device configuration.
Why use the Portal for all Monitoring products?
- For more than 5 devices, using the portal for system management is more comfortable.
- The SensDesk Technology based Portals can detect a failure of power or Internet connection (of the device), and can alert the problem
- With the Portal, all settings are done in a single place (not inside several device's web interfaces).
- The Portal provides:

- Graphs / Multi-graphs
- Product filtering
- PDF reports
- Long-term storage of measured values
- Display values from anywhere
- SMS messages and Voice Call alarms
- Open API (XML and SNMP) for all the sensors

Examples of installations
- SensDesk in Pharmacy and Medical
- Warehouse and storage rooms
- SensDesk in hotels and house rentals
- SensDesk in stores and retail
- SensDesk in School and public buildings
- SensDesk in BTS stations and technology
- SensDesk in Data centers and server rooms
- SensDesk in Smart cities and municipalities
- SensDesk in logistics and transportation
- SensDesk in Industry and manufacturing
- SensDesk in Wine shops
- SensDesk protects against water leaks & construction damage
Portal providers 


The www.SensDesk.com service is operated by the HW group for customers as a global service.
Several HW group partners operate the SensDesk technology-based services in local languages at different URLs under different names and with different combinations of services and prices.
The current list of Portal providers is available on the main page www.HWg-cloud.com.
Device migration
The device can be migrated among different Portal services (transferred from a service to another one). When transferring the device, detailed settings of alarm ranges, sensors’ naming, etc. are always lost.
Summary: www.SensDesk.com is just one of several SensDesk Technology based public portals. Other portals can be found at different URLs with different prices for services.
Comparison of the SensDesk.com and the HWg-cloud
The www.HWg-cloud.com is basic service provided by the HW group with the products free of charge.
Professional service is the www.SensDesk.com ith several paid annual subscription plans.
Same services you can find on other portals based on SensDesk Technology.
| SensDesk.com | HWg-cloud.com | |
|---|---|---|
| License type | SaaS | SaaS |
| Typical use | Global monitoring service | Central Device management |
| Price | From 12 € / month | Free of charge |
| Number of monitoring devices | 5/ 10 / 25 more | Up to 20 devices |
| Number of sensors | Unlimited | Unlimited |
| History (database) | 30/ 365/ 730 days | 10 days |
| Device management | Yes | Yes |
| Alerting | Basic + Advanced | Basic; E-mail; only 2 Targets |
| SMS alerts | Yes (SMS-GW + Twiliio service) | No |
| Phone call alerts | Yes (SMS-GW + Twiliio service) | No |
| PDF Reports | 1/ 2/ 5 / more | No |
| Dashboards | 1/ 2/ more | 1 |
| Output control | Web + actions | Web |
| Multigraphs | 1/ 2/ 5 / more | No |
| Actions | Email, SMS, Set Output, SNMP Trap | No |
| Open API | SNMP, XML | No |
| Mobile App(s) | HWg monitor | - |
| Amount of Teams | 1 | 1 |
| Users in one Team | 1/ 2/ 3 / more | 1 |
| Device Invalid Alert | Up to 1 hour (LAN devices) | Up to 1 hour (LAN devices) |
| Default Data upload period | LAN devices: 15 minutes NB-IoT devices: 10 hours |
LAN devices: 15 minutes NB-IoT devices: 10 hours |
| Default Logging period | LAN devices: 5 minutes NB-IoT devices: 15 minutes |
LAN devices: 5 minutes NB-IoT devices: 15 minutes |
| Customization | Not available | Not available |
| Annual fee to HW group | Included in the monthly plan | No (free service) |
| Use of own SMTP server | No | No |
| Can run in private network | No | No |
| Updates and upgrades | Automatically | Automatically |
You can test on your own - the demo account
To test the service, neither HW group devices nor sensors are needed.
Clicking on the "TRY DEMO" button, the demo user is filled in. Using the "LOG IN" button, the portal is entered.

Properties of user’s account/ team

To use the portal, the difference between a specific user (account) and a team (company) is important to be understood. The user’s account defines personal settings (time zone, language, etc.).
All the services are adjusted in the team (company). The team covers all the resources (users, devices, reports, alerts) those are associated with the team (not the user). Thanks to this concept, the creator of the entire profile (team) can leave the company within several years. Anyway the company does not lose team data, settings and other resources.
The number of allowed (used) SMS, the limit on the number of devices, MultiGraphs, PDF reports, the expiration date of the service subscription, etc. can be found on the team website.
Settings of the device, where data should be sent under a password, could be found there as well.

In all versions of the Subscription plans, the SesnDesk.com service includes the option to notify an alarm by an Email, an SMS and a Telephone call (Voice Call) to the specified phone number.
, the SesnDesk.com service includes the option to notify of an alarm by sending an SMS and making a Voice Call to a set phone number in addition to an email.") When the phone is picked up, the system plays a message. In a real situation, the call is faster to be rejected and a text message (SMS) to be read (that has been already probably received).
When the phone is picked up, the system plays a message. In a real situation, the call is faster to be rejected and a text message (SMS) to be read (that has been already probably received).
The number of SMS and calls per month may vary according to the subscription plan and an individual portal provider. The limit of messages and Voice calls is always related to the period from the first to the last day of the month. The limit is always related to the team (company), and not to the connected users.
Sending SMS and Voice calls is a part of the SensDesk service. Neither additional fees nor own SMS Gateway are required.
Each sensor contains its own SafeRange. When this range or other adjustable values (notice range) are exceeded, an alarm SMS message can be sent.
In order to emphasize the alarm, the Voice Call can be added (to be checked as an SMS extension).
The www.SensDesk.com uses the preset Twilio service to communicate with the mobile phone network.
Customer’s SMS-GW
The HW group produces the SMS-GW (a GSM/LTE device).

This gateway is a physical device with a LAN port, an antenna and a SIM card slot. Thanks to this gateway, the individual HW group products can send alarm SMS and telephone calls.
Owning the SMS-GW allows the gateway to be connected to team's account on www.SensDesk.com. Then, SMS and phone calls can be done via the SIM card. In that case, the above-mentioned limit of SMS and voice calls
The SafeRange is adjusted for each sensor. When the value exceeds the set SafeRange limit, the portal sends an email within few seconds.
What does SafeRange mean
The SD SafeRange (the safe range of values) can be set for each sensor. When the measured value in the device exceeds the limit, the SafeRange communicates with the portal immediately. The subsequent alarm leaves the portal within few seconds. Response to the change of a measured value is very fast when the SafeRange limit is exceeded. In case of battery-powered products, the reaction speed may vary with powering (the external one / the battery one; the low-energy mode).
Note: For correct and fast operation of the whole system, the SafeRange value has to be set for each sensor used; default values should not be kept.

The portal sends a notification when:
- Value of the sensor is out of the SD SafeRange
- Power supply is not available for the device with the connected sensor
- Internet connection is not available for the device with the connected sensor
Notice / SD SafeRange actions
Action (email or SMS alert / switching Output) can be initiated by any value exceeding the Notice range or SD SafeRange.
There are several differences between them.
- SD SafeRange can be used only one per each one sensor
- SD SafeRange is synchronized from the portal to the device = device communicate much faster to the portal vhen value passing by the range limit = there are much faster reaction to value changes.
- Notice range is analyzed in the Portal only.
- You can have unlimitted amout of Notice ranges.
| Device / Portal | Portal alert fast | Portal alert |
| Alert initiated from | SD SafeRange (one per sensor) | Notice Range |
| Alert initiated (triggered) by | Device (local) alert - sensor value | Portal compare value when received |
| Sensor value hysteresis | Yes | Yes |
| Time from sensor value to Alert | Fast (1-10 seconds) | Variable (1sec - 15min) |
| Alert type | Email, SMS, Voice Calls | Email, SMS, Voice Calls |
| Alert is sent (realized) by | SMTP server in the Portal / ext. service | SMTP server in the Portal / ext. service |
| Internet connectivity | Required | Required |
| Alerting costs | Email is free, other by subscription plan | Email is free, other by subscription plan |
| Conditions limit | Only 1 SafeRange per sensor | Unlimitted |
| Definable text in alert message | Yes (editable templates) | Yes (editable templates) |
| Repeating alerts (reminder) | Yes | Yes |
| Alert escalation options | Yes (as Notice Range) | Yes |
| Alert delay | Yes | Yes |
| Alerting options: HWg-cloud.com | Email only | Email only |
| Alerting options: SensDesk.com | Email, SMS, Voice Calls | Email, SMS, Voice Calls |
| Alerting options: Portal providers | Defined by provider | Defined by provider |
Quick warning when the DI status changes
DI (digital inputs) can be found in the group Sensors (the Detectors tab has to be clicked).
 can be found in the Sensors group where you need to click the Detectors tab.")
DI (Detector) parameter setting
A detector is a two-state signaling device (door = open/closed). Typically, the detector is connected to DI inputs of the device. The detector signals the status by a relay of an output typically.
- States 0/1 (OFF/ON) can be named
- For each DI input, the "green" signaling on the Dashboard has to be set
- For each DI, an alarm status can be set (Not defined is the default status).
- Then, the change of the DI status is signaled very quickly from the device (as the SafeRange is exceeded from sensors)
.")
Actions based on alarm status
In the basic version, the alarm status is defined by the
- SafeRange for sensors
- Active Alarm status for Detectors (DI)
How to respond to an alarm
- By no response (only the color changes on the list of sensors and DI)
- By sending an email
- By sending an SMS
- By sending SMS + Voice Call
- By closing/ opening the remote relay of the output
, typically connected to the DI inputs of the device.")
The action can be set directly in settings of the Sensor or DI

- For each DI alerthas to be defined the alarm state (Open/Close or 0/1)
- A template has to be selected for SMS and email (can be changed)
- A useful button Save and Send Test can send a test SMS and an email
Advances alarm options
- An email can be sent with a delay. E.g., open doors can be alerted when being opened for 10 minutes at least.
- The user can edit the text of the email and SMS using templates
- Alarm at different values (to different recipients) can be sent from the same sensor
Alarm escalation
- The alarm message is repeated after a certain time interval when the alarm status still lasts (e.g. every 4 hours)
- The alarm message (email) is forwarded to another user after a certain time
- The alarm is reminded to the same/ different user if the situation worsens (temperature is even higher for example)
List of sensor values
The list of all the sensors can be easily shown via the Sensors tab. Here, the DI list (detectors) and the DO list (relay outputs) can be found as well.
 and DO (relay outputs).")
Switching on the top tab from the item Sensors to Detectors, the DI (detectors) and their status can be listed.
Tabular display of sensor values or DI inputs.
In case of a large number of sensors or detectors, the display of indicators is recommended to be switched from the default view to the table view of values (the upper right marked option next to "Sort By" or "Clear filter").
 and their statuses, switch from Sensors to Detectors in the tab above")
The meaning of symbols at State can be found here: https://www.hw-group.com/support/dashboard-and-my-dashboard-functions-in...

The team Dashboard is focused to 4 essential indicators. This type of Team summary is appreciated in case of larger projects with dozens of devices mainly

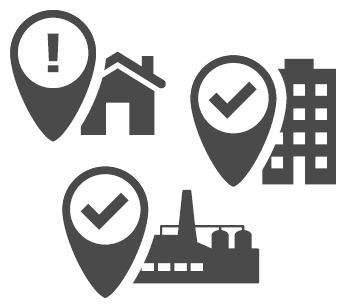
The dashboard is the main page of the portal for users. The dashboard summarizes the status of all connected devices and sensors for users. For proper operation, the SafeRange has to be correctly adjusted on each sensor. The dashboard summarizes the account into 4 categories:

- OK (green) is an overview of all the sensors + DI those operate and measure the value in the adjusted "SafeRange" / out of the Alarm status.
- Alarm (red) is an overview of all the sensors + DI those operate and measure the value in the alarm range / status.
- Invalid (yellow) is an overview of all the sensors + DI those do not operate
- Disabled (gray) is an overview of all the deactivated sensors + DI.
- The dashboard is a clear list of sensors and devices from the viewpoint of the system administration.
- The user can have several dashboards. The dashboards can be divided by the location or by the customer.
- The dashboard is a quick summary showing which sensors are OK / Alarm in a location / in device group.
Overview of all the sensors in the Dashboard 
The list shows all the changes from last 2 hours (in the example, the list is empty).
All the sensors sorted by alarm events can be displayed by clicking the Show All sensors button.

Note: The system can operate only if the SafeRange and the Alarm status for DI are adjusted for all the sensors correctly.
History of events
The bookmark EventLog contains a list of all the events when the measured value exceeded the SD SafeRange or the sensor was disconnected. Comments can be added to individual events.

DO control (relay)
From the web interface of the portal, relay outputs on remote devices can be controlled by clicking a button. The reaction time can vary from few seconds to few minutes, depending on the type, version of the device and the device configuration.

The output control buttons can be found in the detail of each device.

Portal provides automatic output responses depending on conditions from different sensors and devices in the same user’s account. E.g., the heater or the alarm light are being turned on when the temperature exceeds 30°C.

The portal displays the graph of value responses of individual sensors. The graph of a value can be displayed for the entire period of the stored history. The time of keeping the stored data can vary according to the selected tariff (the annual plan).
The data displayed in the graph can be manually:
- Saved as a PDF / PNG / JPG / SVG image
- Exported to a CSV / XLS file

Graphs of responses of DI and sensors
In the detail of each device, a graph with an overview of all values of sensors / DI and DO states can be found. However, these are only the sensors connected to the device.

The data displayed in Graph / MultiGraph can be exported (only manually).
For automatic processing, the CSV report attachment can be used.

MultiGraph 
In order to display multiple values in a single graph, the MultiGraph function can be used on the Portal. The number of MultiGraphs is limited by the annual subscription plan.
The MultiGraph can be assembled as an overview of arbitrary values in the account. The MultiGraph is popular for comparing time events.

- In the picture, two temperature values are shown on the blue axis on the left.
- On the red axis on the right, the DI input is displayed in red.
PDF Reports 

The report is understood to be a PDF email attachment or a CSV one that is regularly sent (daily /weekly/monthly). In the general version, the PDF contains the response of selected sensors and DI in a single MultiGraph + a list of critical values.
. In the general version of PDF, it contains the course of selected sensors and DI in one Multigraph + a list of critical values.")
• General - a graph + a list of critical values
• Differential - a graph + a basic table with values at the beginning and at the end of the period
• CSV - contains all the measured values for a given period and a sensor / DI.
- The PDF file can be signed.
- Reports can meet Gamp5 requirements.
- For battery powered products, an overview of the battery status can be interesting.
Open API: SNMP + XML 
The SensDesk.com portal has an open API which values can be connected to third-party systems.
All the instantaneous values of sensors and DI are available via open interfaces:
- SNMP (version 1 / version 3)
- XML via http get
- Shared values can be related to the whole Team (company). Then, the access data on the Team page apply
- For individual users, the displayed values can be limited by permission groups. Then, the access data for the user apply (see the figure).
- By default, values from the API can be read once per minute.

Devices and sensors can be sorted by their physical location (postal code / ZIP) or into the groups. This function is not needed for few devices but is very important for 15 devices, 50 sensors and a long-term use.
- Device groups serve to sort the devices (only)
- Locations / Sub-locations can be used to sort both the devices and the sensors
 or into groups.")
For example:
- Sensor Location = Prague office
- Sensor SubLocation = 2nd floor
Remote managing of the device 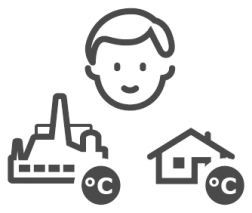
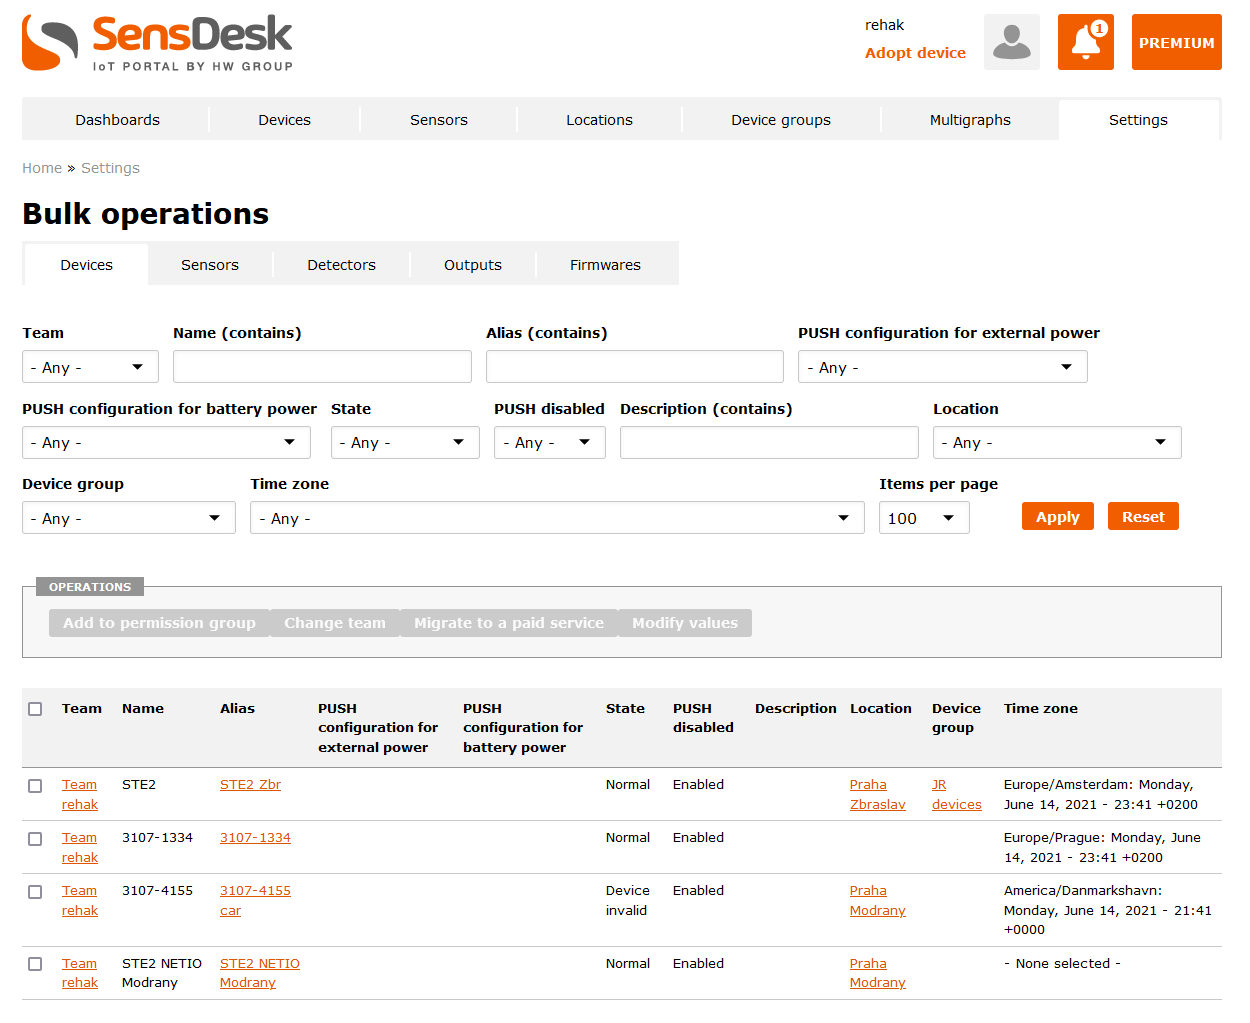
The central device management is the key utility value of the portal for larger projects.
- Remote FW upgrading for some products
- SafeRange settings for sensors
- Central management of email alerts from DI and sensors.
- Additional functions according to the device type
.")
Devices for applying new properties (bulk operations) can be filtered in detail.
Links and further steps
Starting with the SensDesk
https://www.hw-group.com/support/getting-started-with-sensdesk
SensDesk solutions
https://www.hw-group.com/solutions/monitoring