
Icinga
The heart of your monitoring environment
Icinga is a professional monitoring solution that continuously monitors all systems in your network, collecting data on availability and performance, and generating alerts in the event of unplanned downtime or problems.
The environments of complex network environments have never been simpler: after enabling Icinga’s built-in cluster feature, you can start configuring the highly available and distributed monitoring setup.
- Efficient Monitoring Engine
- Appealing Web UI
- Safe and Secure
- Get Notified Immediately
- Rule-based configuration
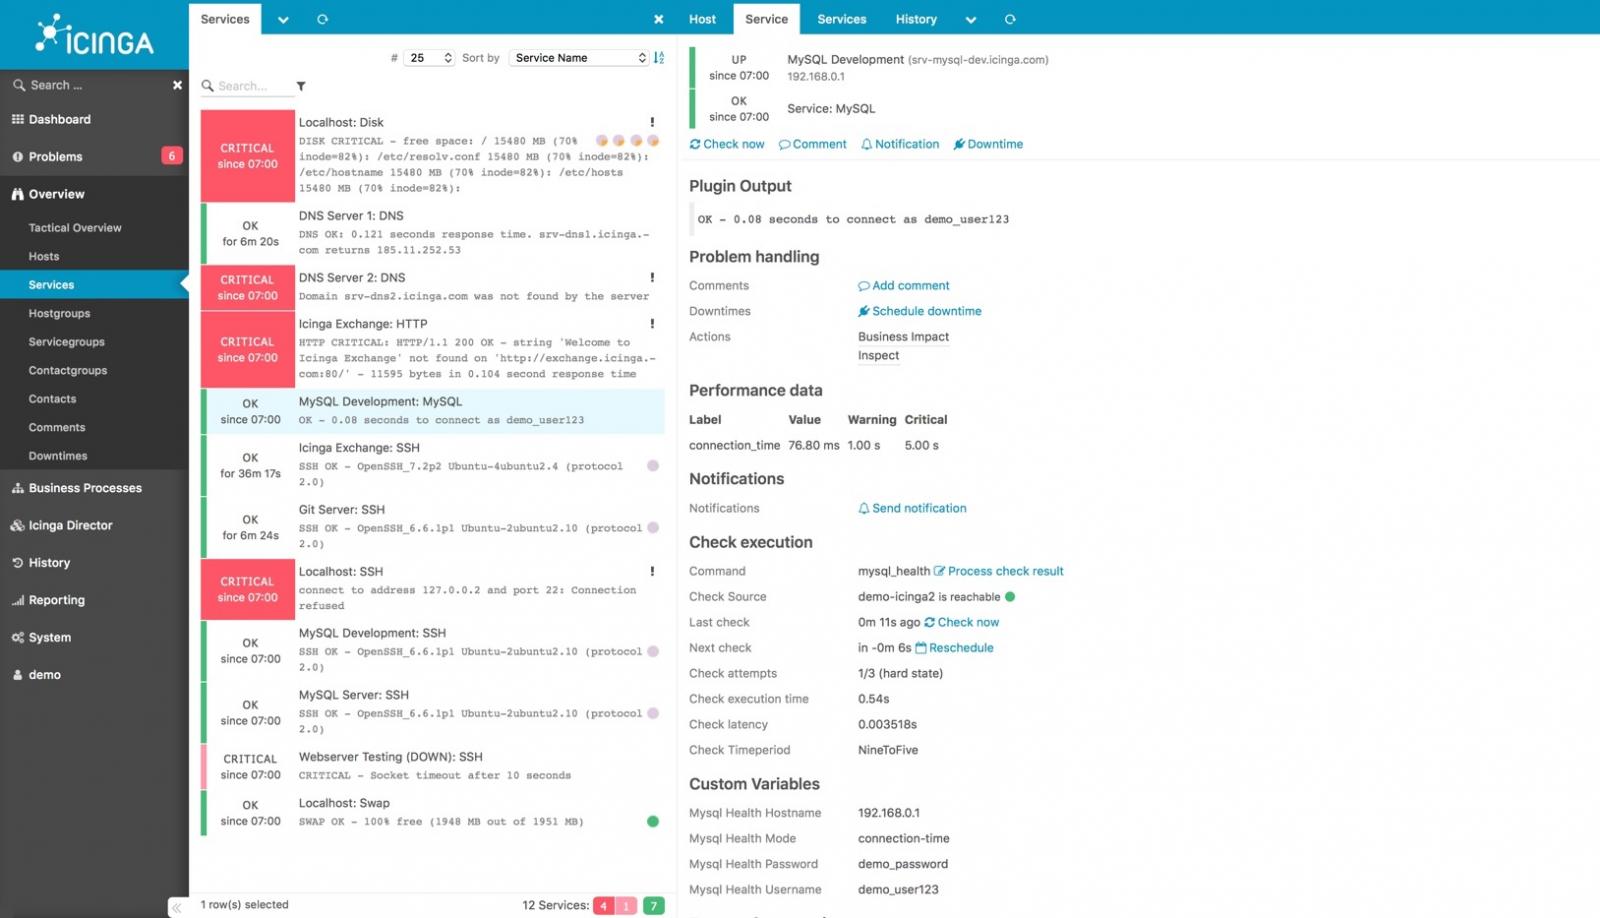
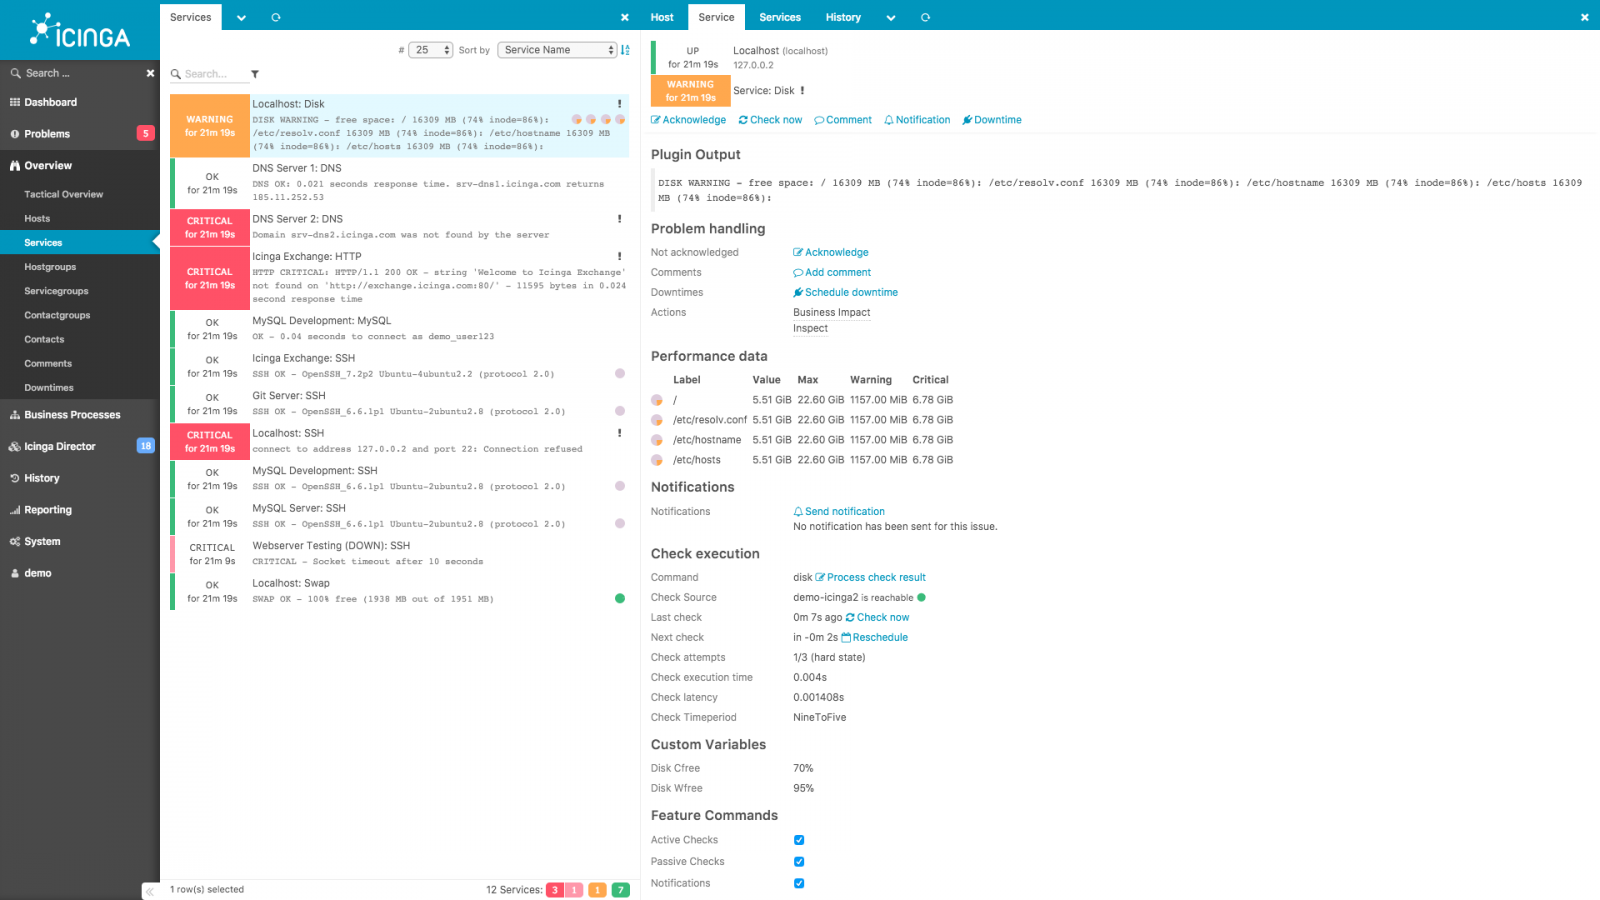
Experience a new perspective
The web interface of the latest Icinga generation offers significantly higher performance than all previous solutions, supports various backends and shines with an intuitive and dynamic layout.
Custom-fit extension
Icinga Web has a module interface that makes it easy to integrate extensions into the web interface. A large number of already existing modules can be used for Icinga Web or individually adapted to existing needs.


You decide what fits best
Icinga is characterized by a broad support of modern log, configuration and metrics solutions. So you decide for yourself which solution suits your environment best.
- Configuration - Monitoring as Code has never been easier. Use the potential of the Icinga configuration or use an existing solution. Be it Puppet, Chef, Ansible or SaltStack, no problem for Icinga.
- Log management - For medium - and long-term storage and subsequent analysis of log files, many solutions have become established on the market. Be it the Elastic Stack, Graylog or even commercial variants like Splunk. Icinga offers a variety of interfaces for connecting your environment.
- Performance & Metrics - Icinga delivers all performance data for downstream analysis to connected products. Icinga immediately provides interfaces for Graphite, InfluxDB and OpenTSDB as a core feature. Just activate the feature and off you go.